Battery Raw Materials
Graphite Supply Chain in 2026: Risks and Opportunities
 Written bySamir Jaber
Published on
Share Post
Battery Raw Materials
Written bySamir Jaber
Published on
Share Post
Graphite is the dominant anode material in lithium-ion batteries, and demand is accelerating with electric vehicles and energy storage. The International Energy Agency estimates that battery demand could drive graphite consumption to 6-30 times current levels by 2040.
At first glance, supply appears sufficient given global reserves. In practice, availability depends on the ability to convert raw graphite into battery-grade material through purification, shaping, and qualification. These downstream stages remain highly concentrated in China, which holds the majority of global processing capacity, according to the U.S. Geological Survey.
With demand for battery-grade graphite surging, is the real challenge one of raw material scarcity, or is it the global supply chain’s dependence on China for processing and the market’s fundamental lack of transparent price discovery?
Graphite is a family of materials that diverges significantly depending on origin, processing route, and end-use application. It is not a single commodity with a single price.
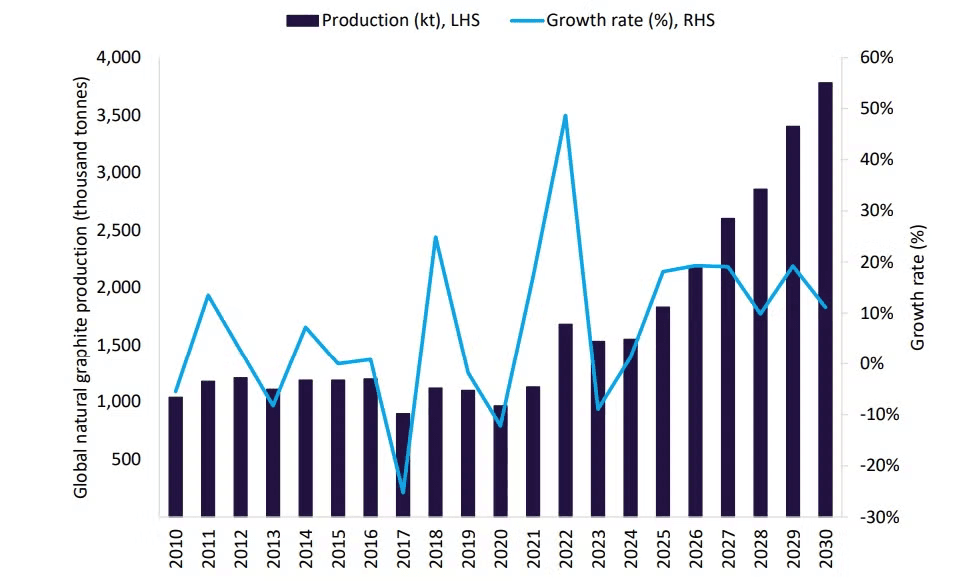
Global natural graphite production and growth rate, 2010–2030. Source: GlobalData.
Natural graphite is mined across multiple countries, with China accounting for roughly 78% of global mine output at approximately 1.27 million metric tonnes in 2024.
Mozambique, Madagascar, and Tanzania form a smaller second tier, though Mozambique alone is projected to grow nearly seven-fold to 247,500 tonnes in 2025 following the restart of Syrah Resources’ Balama project. Natural graphite is available in large, medium, and fine flake grades, each priced based on carbon content and particle size.
Synthetic graphite, on the other hand, is manufactured by heating petroleum coke or needle coke in electric furnaces above 2,500°C—a process called graphitization, which reorganizes carbon atoms into a crystalline structure. It’s more energy-intensive and expensive per tonne, but delivers tighter specification consistency, which battery manufacturers value for predictable electrochemical performance.
The cost advantage of synthetic graphite over natural graphite is not fixed, though. It depends on petroleum coke pricing, which in turn depends on crude oil. The Hormuz disruption, which has pushed oil above $100 and effectively closed the world’s most important energy corridor since February 2026, is already affecting feedstock economics for synthetic graphite producers outside the Gulf region.
Raw natural graphite is not battery-ready. Reaching anode-grade specification requires three steps:
“Spherical graphite costs three to four times more than equivalent flake concentrate, before a single battery cell is made.”
New anode materials don’t come off the shelf. They must pass extensive qualification testing across charge-discharge cycles, thermal behaviour, and cell chemistry compatibility. In early 2026, Syrah Resources was required to extend its qualification deadline with Tesla for its Louisiana anode facility, illustrating how drawn-out the process can be even with an established offtake customer.
China holds approximately 90% of the global anode material market and hosts around 98% of global graphitization capacity. The IEA projects that, even with active diversification efforts, China could still supply around 80% of global battery-grade graphite by 2035.
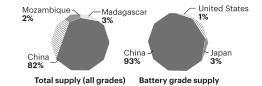
Projected graphite supply by producer, 2030. Source: IEA.
More than 94% of African flake graphite is currently shipped to China for processing before re-entering global supply chains. In practice, African graphite mines are supplying Chinese processors rather than building an independent supply route.
China recognised the leverage embedded in this position and moved to formalise it. In late 2023, Beijing introduced export permit requirements covering high-purity, high-hardness, and large-flake natural graphite, as well as spherical graphite. The official reason was national security. The practical effect was that non-Chinese buyers gained a new layer of uncertainty in their supply chains.
The permits haven’t triggered a total embargo, but they sent a clear message that access to Chinese-processed anode material is conditional, and Beijing sets the conditions. The US responded with its own escalation. In July 2025, the US Commerce Department set a 93.5% preliminary anti-dumping duty on Chinese anode-grade graphite.
Despite demand for graphite rising by an estimated 6–8% in 2024, graphite prices fell by 10–20% over the same period, according to the IEA’s Global Critical Minerals Outlook 2025. The reason is that China expanded processing capacity faster than near-term demand could absorb it, compressing producer margins in the process.
That oversupply has squeezed Chinese producer margins and created short-term commercial opportunities for buyers. However, this does not resolve the longer-term question of what happens when Chinese processing capacity stops being a source of competitive supply and becomes a tool of trade policy instead.
African countries such as Mozambique, Madagascar, and Tanzania collectively hold 69 million tonnes of graphite reserves, roughly 21% of the global total, with deposits that are competitive in terms of flake grade and carbon content. Fastmarkets reported in 2025 that African producers were fielding more inquiries from non-Chinese buyers.
Madagascar’s production back in 2024 reached 89,000 metric tonnes, up 41% from 2023. Mozambique’s Balama project, the world’s largest single graphite mine with a capacity of 350,000 MT/year, returned to ramp-up in 2025 after earlier curtailments.
However, African mines lack the capacity for purification, spheronisation, and graphitization, so supply routes run through China by default. As most African material continues to be shipped to China for processing, building that capacity elsewhere requires capital, energy infrastructure, regulatory permissions, and validated offtake agreements.
In practical terms, a tonne of large-flake graphite mined in Tanzania today is more likely to be processed in Qingdao than in Dar es Salaam. It will re-enter global supply chains as spherical graphite with a Chinese origin label, absorbed into a battery cell destined for a European or North American vehicle.
Europe faces the same problem in a more acute form. The EU extracts less than 0.1% of its graphite needs domestically, while demand is projected to reach 480,000 tonnes by 2030. The Critical Raw Materials Act designated graphite as a strategic material, and the Commission approved projects in 2025 targeting domestic extraction and processing.
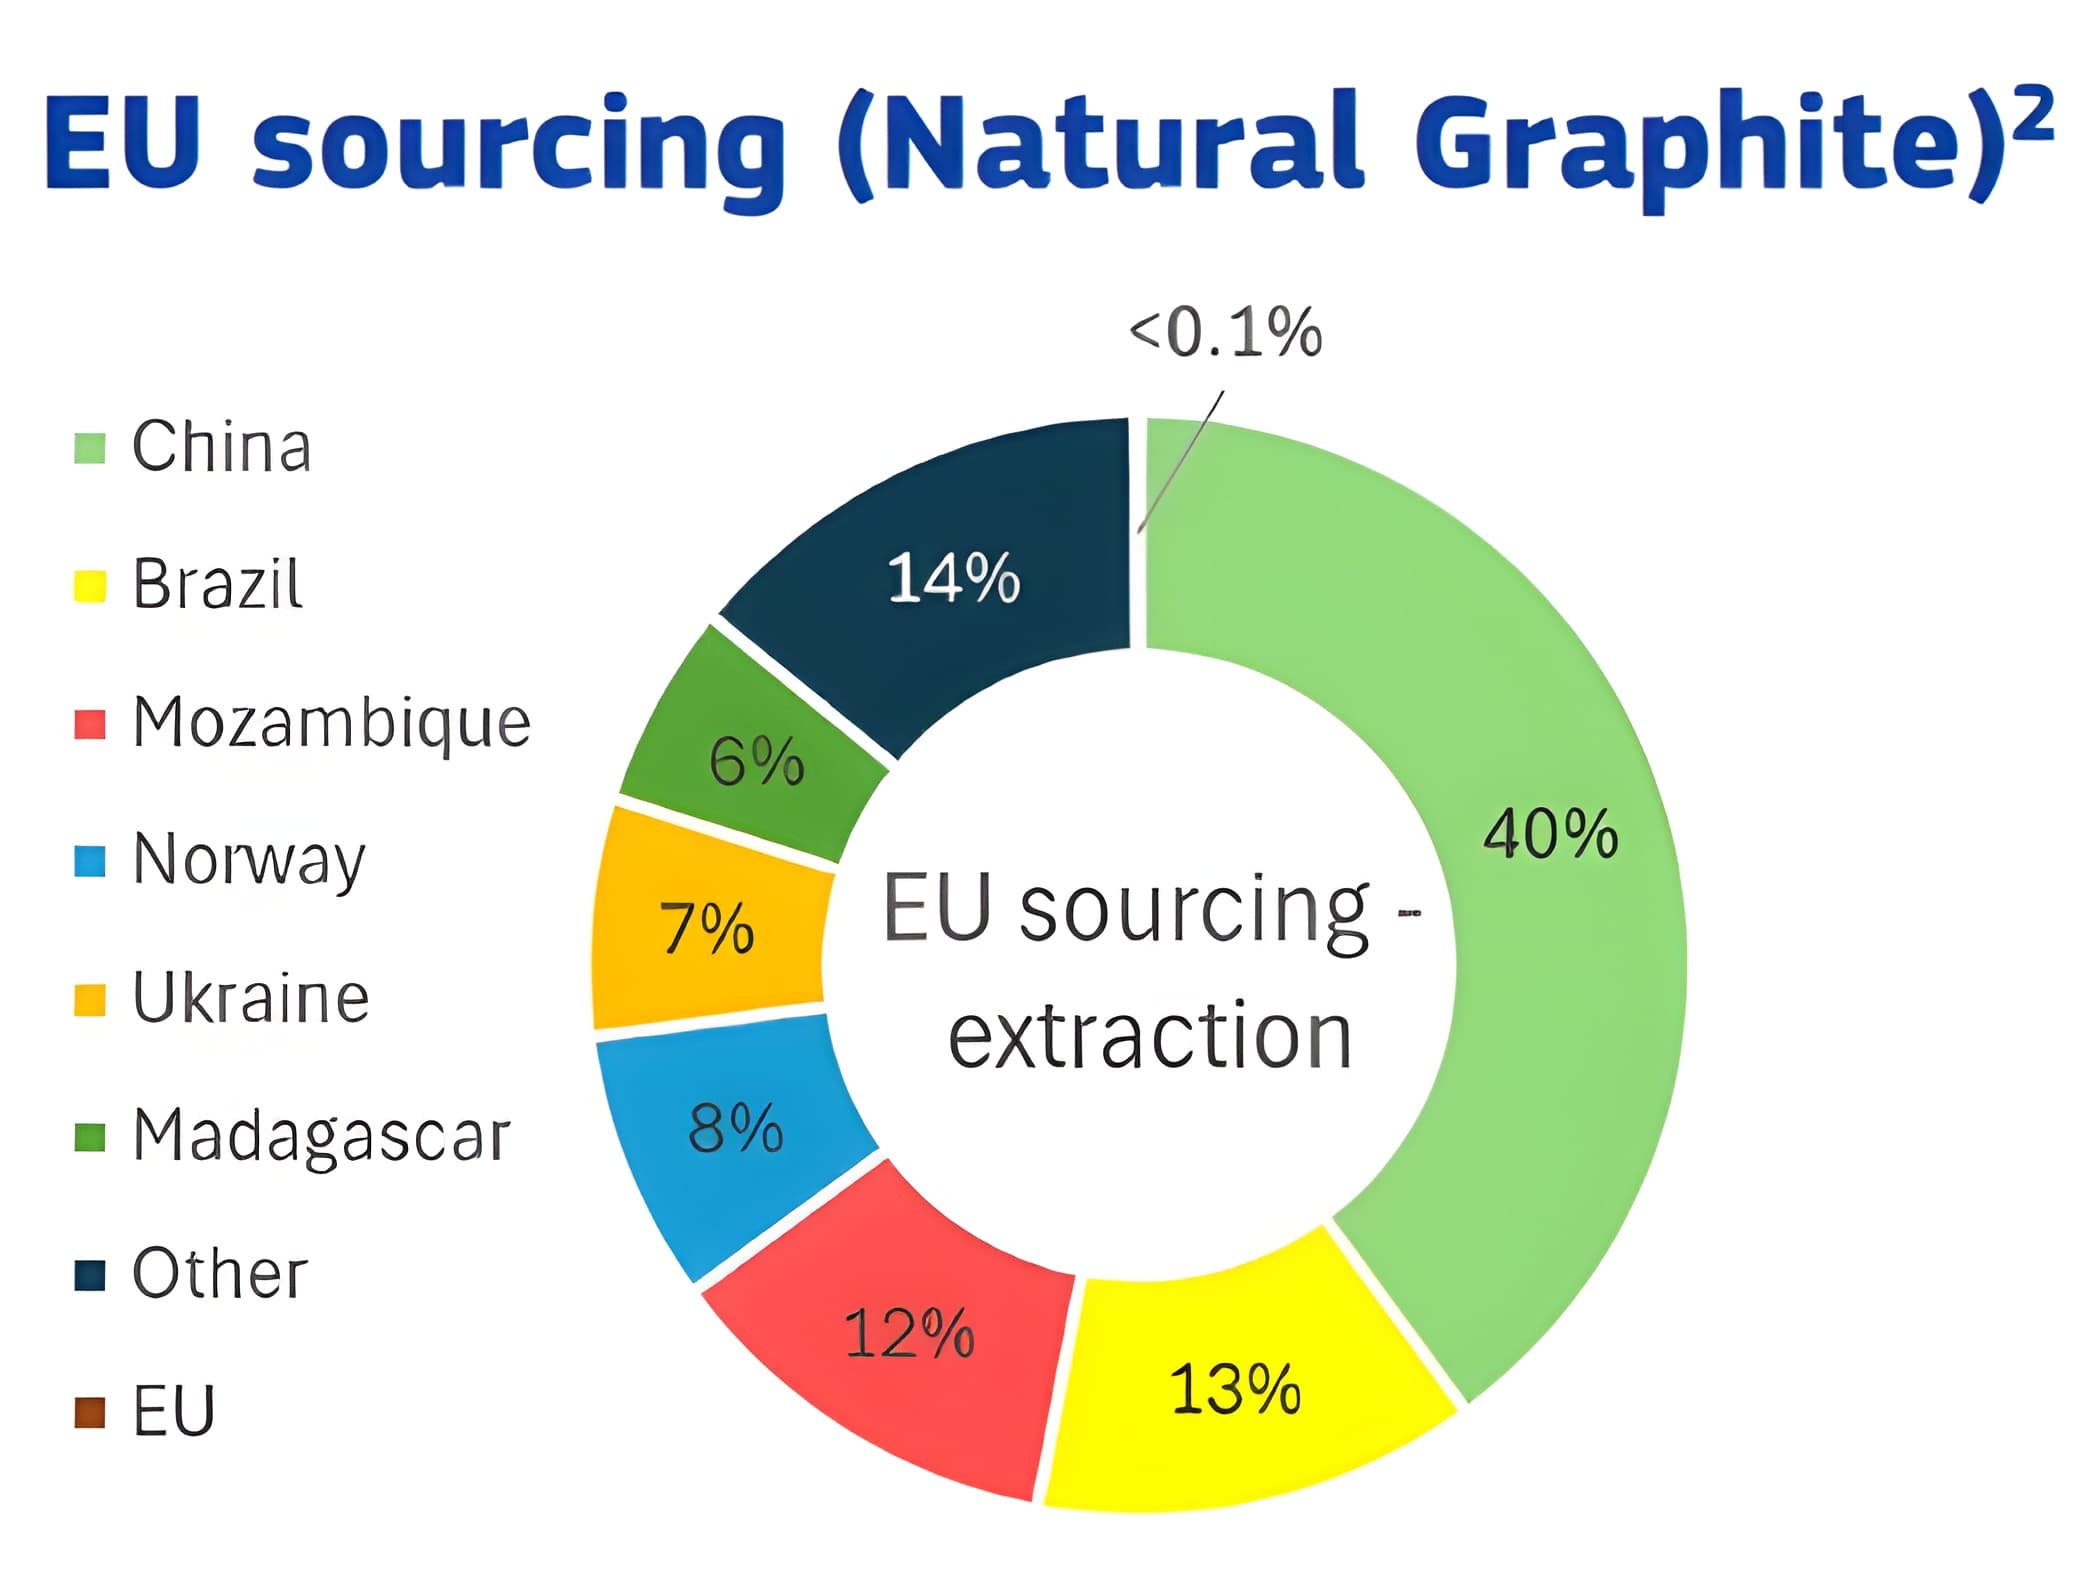
EU natural graphite sourcing by country of extraction. Source: European Commission.
The commercial infrastructure is beginning to catch up. In March 2026, Northern Graphite, which operates North America’s only producing graphite mine in Quebec, moved the majority of its spot sales to Metalshub and ran competitive events across multiple flake graphite grades.
It is an early signal that non-Chinese producers are starting to build the sales and price-discovery mechanisms that a diversified market requires, not just mining capacity.
While the immediate focus on diversification has been on building new primary mining and processing capacity outside of China, a more immediate and localised route to supply resilience is emerging through battery recycling.
Recycling directly addresses the geopolitical and environmental challenges in the primary graphite market:
However, scaling this circular supply chain presents new commercial challenges. The market for recycled material—including materials like recycled graphite—is new, fragmented, and lacks established price benchmarks.
To support this emerging market, Metalshub is building a European platform dedicated to battery recycling raw materials. This digital marketplace is designed to create structured, transparent access for secondary raw materials, using competitive bidding events to enable transparent price discovery and qualified buyer engagement in a sector where commercial terms are still being established.
Unlike copper or aluminium, graphite does not have a liquid futures market anchored to a globally recognised exchange benchmark. There is no single reference price for settling contracts, hedging exposure, or assessing counterpart offers on a comparable basis. Instead, graphite pricing operates through a patchwork of assessments published by price reporting agencies (PRAs) such as Fastmarkets, which cover separate products and grades with distinct delivery terms.
Here are some factors that drive price variation within natural graphite alone:
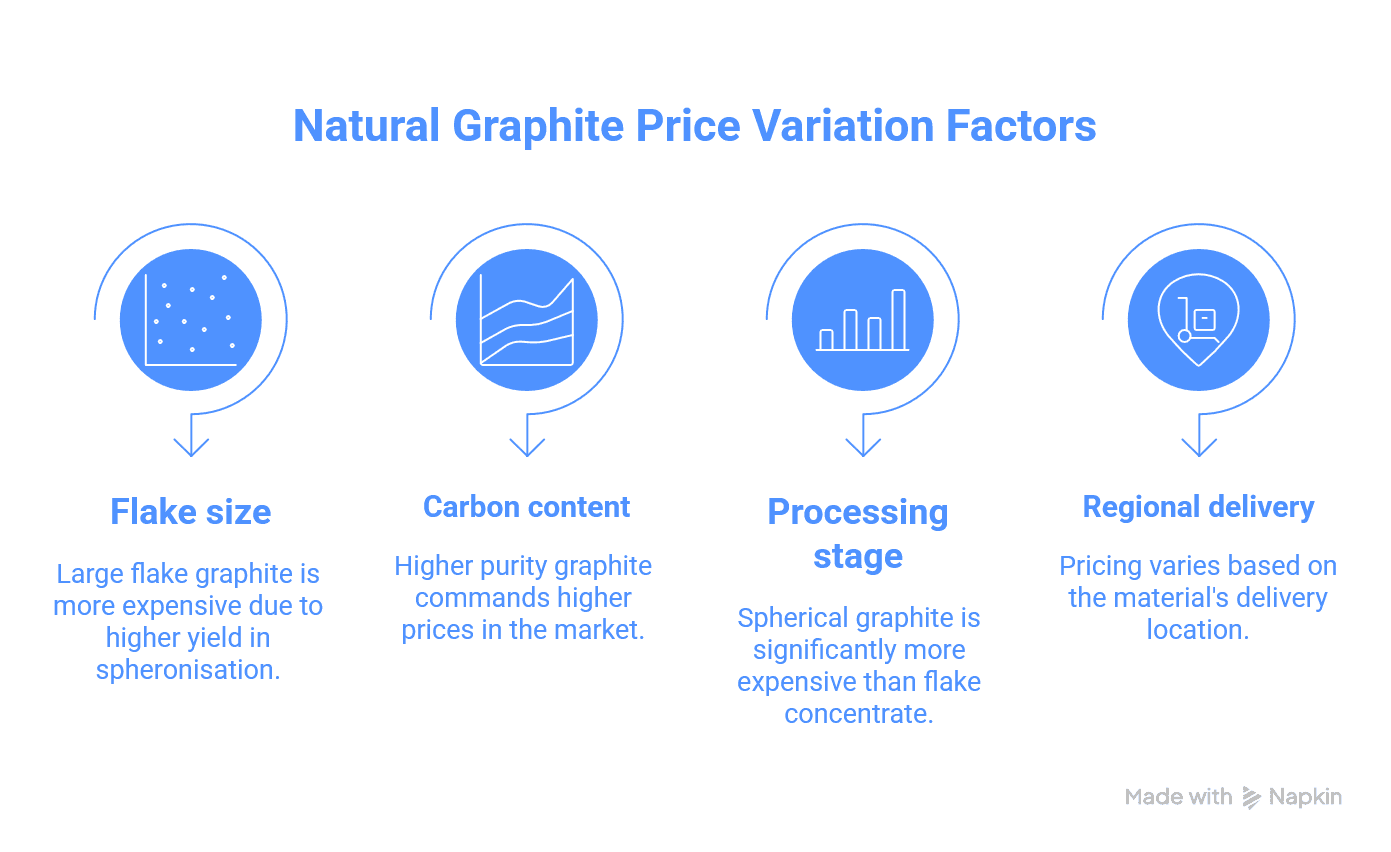
Evaluating a supplier offer requires specialist knowledge of where that product sits in the specification matrix, an understanding of the prevailing price dynamics for that product form, and access to market intelligence that most buyers don’t hold internally.
Without that, suppliers and traders can price opportunistically in a market where buyers have limited visibility into what comparable transactions actually look like. As supply routes diversify and new anode material sources come to market, more origins, processing routes, and counterparts will need to be evaluated against each other.
The transparency gap in graphite creates asymmetric risk on both sides of the market.
For buyers (battery manufacturers, cell producers, OEMs, and industrial purchasers), the primary risk is commercial:
For sellers (producers, processors, and traders), the same opacity creates a different problem:
Graphite serves two distinct end markets that operate on different cycles, respond to different drivers, and should not be read as signals for each other.
Graphite electrodes are large carbon blocks produced from needle coke through graphitization above 2,500°C, used in electric arc furnaces for steel production.
The electrode market has its own pricing dynamics, driven by steel production cycles, needle coke availability, and capacity utilization. It does not move in lock-step with battery demand. Participants in one market should not assume the signals from the other directly apply.
For the battery raw material strategy in 2026, the more relevant question is sodium-ion. Chinese manufacturers have been actively scaling sodium-ion production, in part because the chemistry reduces dependence on lithium, cobalt, and nickel.
Sodium-ion cells use hard-carbon anodes rather than graphite, so growth in sodium-ion adoption reduces the intensity of graphite demand at the margin.
Sodium-ion currently addresses a specific segment: shorter-range, lower-cost applications where energy density constraints are acceptable. Lithium-ion batteries, and with them graphite anodes, remain the dominant technology for passenger EVs, grid storage, and most applications where energy density and cycle life matter.
Metalshub provides a digital trading and market access infrastructure for complex raw materials, including battery materials and specialty minerals. The structural challenges in graphite are precisely the conditions where structured digital infrastructure creates commercial value for both buyers and sellers.
Each inquiry or offer placed through Metalshub captures the full set of commercial parameters that determine value in graphite transactions, including:
By structuring these parameters in a consistent format, Metalshub enables like-for-like comparisons and surfaces price signals that reflect where the market is actually transacting.
As new counterparts enter the graphite market outside of China-centric networks, the platform supports discovery: buyers can access qualified sellers they would not have found through traditional channels, and sellers can reach procurement teams actively looking for alternative supply routes.
Metalshub complements existing price references or long-term supply relationships with transaction-based data and a structured commercial environment that reduces the information asymmetry currently built into graphite trading and enables price discovery in a rather opaque market.
Book a demo to see how Metalshub supports sourcing and price discovery for battery raw materials.
What is the graphite supply chain?
Graphite moves from mined natural flake or synthetic production through purification, spheronisation, coating, and graphitization before reaching battery anode producers and cell manufacturers. Oxford Energy places China’s share of global anode production at approximately 90%.
Why is graphite considered a critical raw material?
Graphite is the primary anode material in lithium-ion batteries, and the IEA projects demand will more than double by 2030. Processing is concentrated in China, near-term substitutes in mainstream lithium-ion chemistry are limited, and that combination meets the threshold for strategic material classification in the EU, US, and other jurisdictions.
What is the difference between natural and synthetic graphite?
Natural graphite is mined and processed through purification, spheronisation, and coating to reach battery-grade specification. Synthetic graphite is produced by graphitizing petroleum or needle coke above 2,500°C. They carry different cost structures, supply chains, and qualification profiles, and are often blended in battery anodes.
Why are graphite prices so hard to track?
There is no single global benchmark for graphite. Prices vary by flake size, carbon purity, processing route, and delivery location, and many transactions are negotiated bilaterally. Fastmarkets publishes separate grade assessments, but spot liquidity is thin and true market levels are difficult to verify.
Is sodium-ion a threat to graphite demand?
Sodium-ion batteries use hard carbon rather than graphite anodes, so adoption does reduce graphite demand intensity at the margin. But lithium-ion remains dominant for passenger EVs and grid storage, and IEA projections show strong growth in graphite demand through 2030.
Newsletter
insights