

Metalshub Analytics Center
Turn Sales Activity into Measurable Margin PerformanceTurn Sales Activity into Measurable Margin Performance
- Full sales visibility
- Clear netback attribution
- Transparent team performance
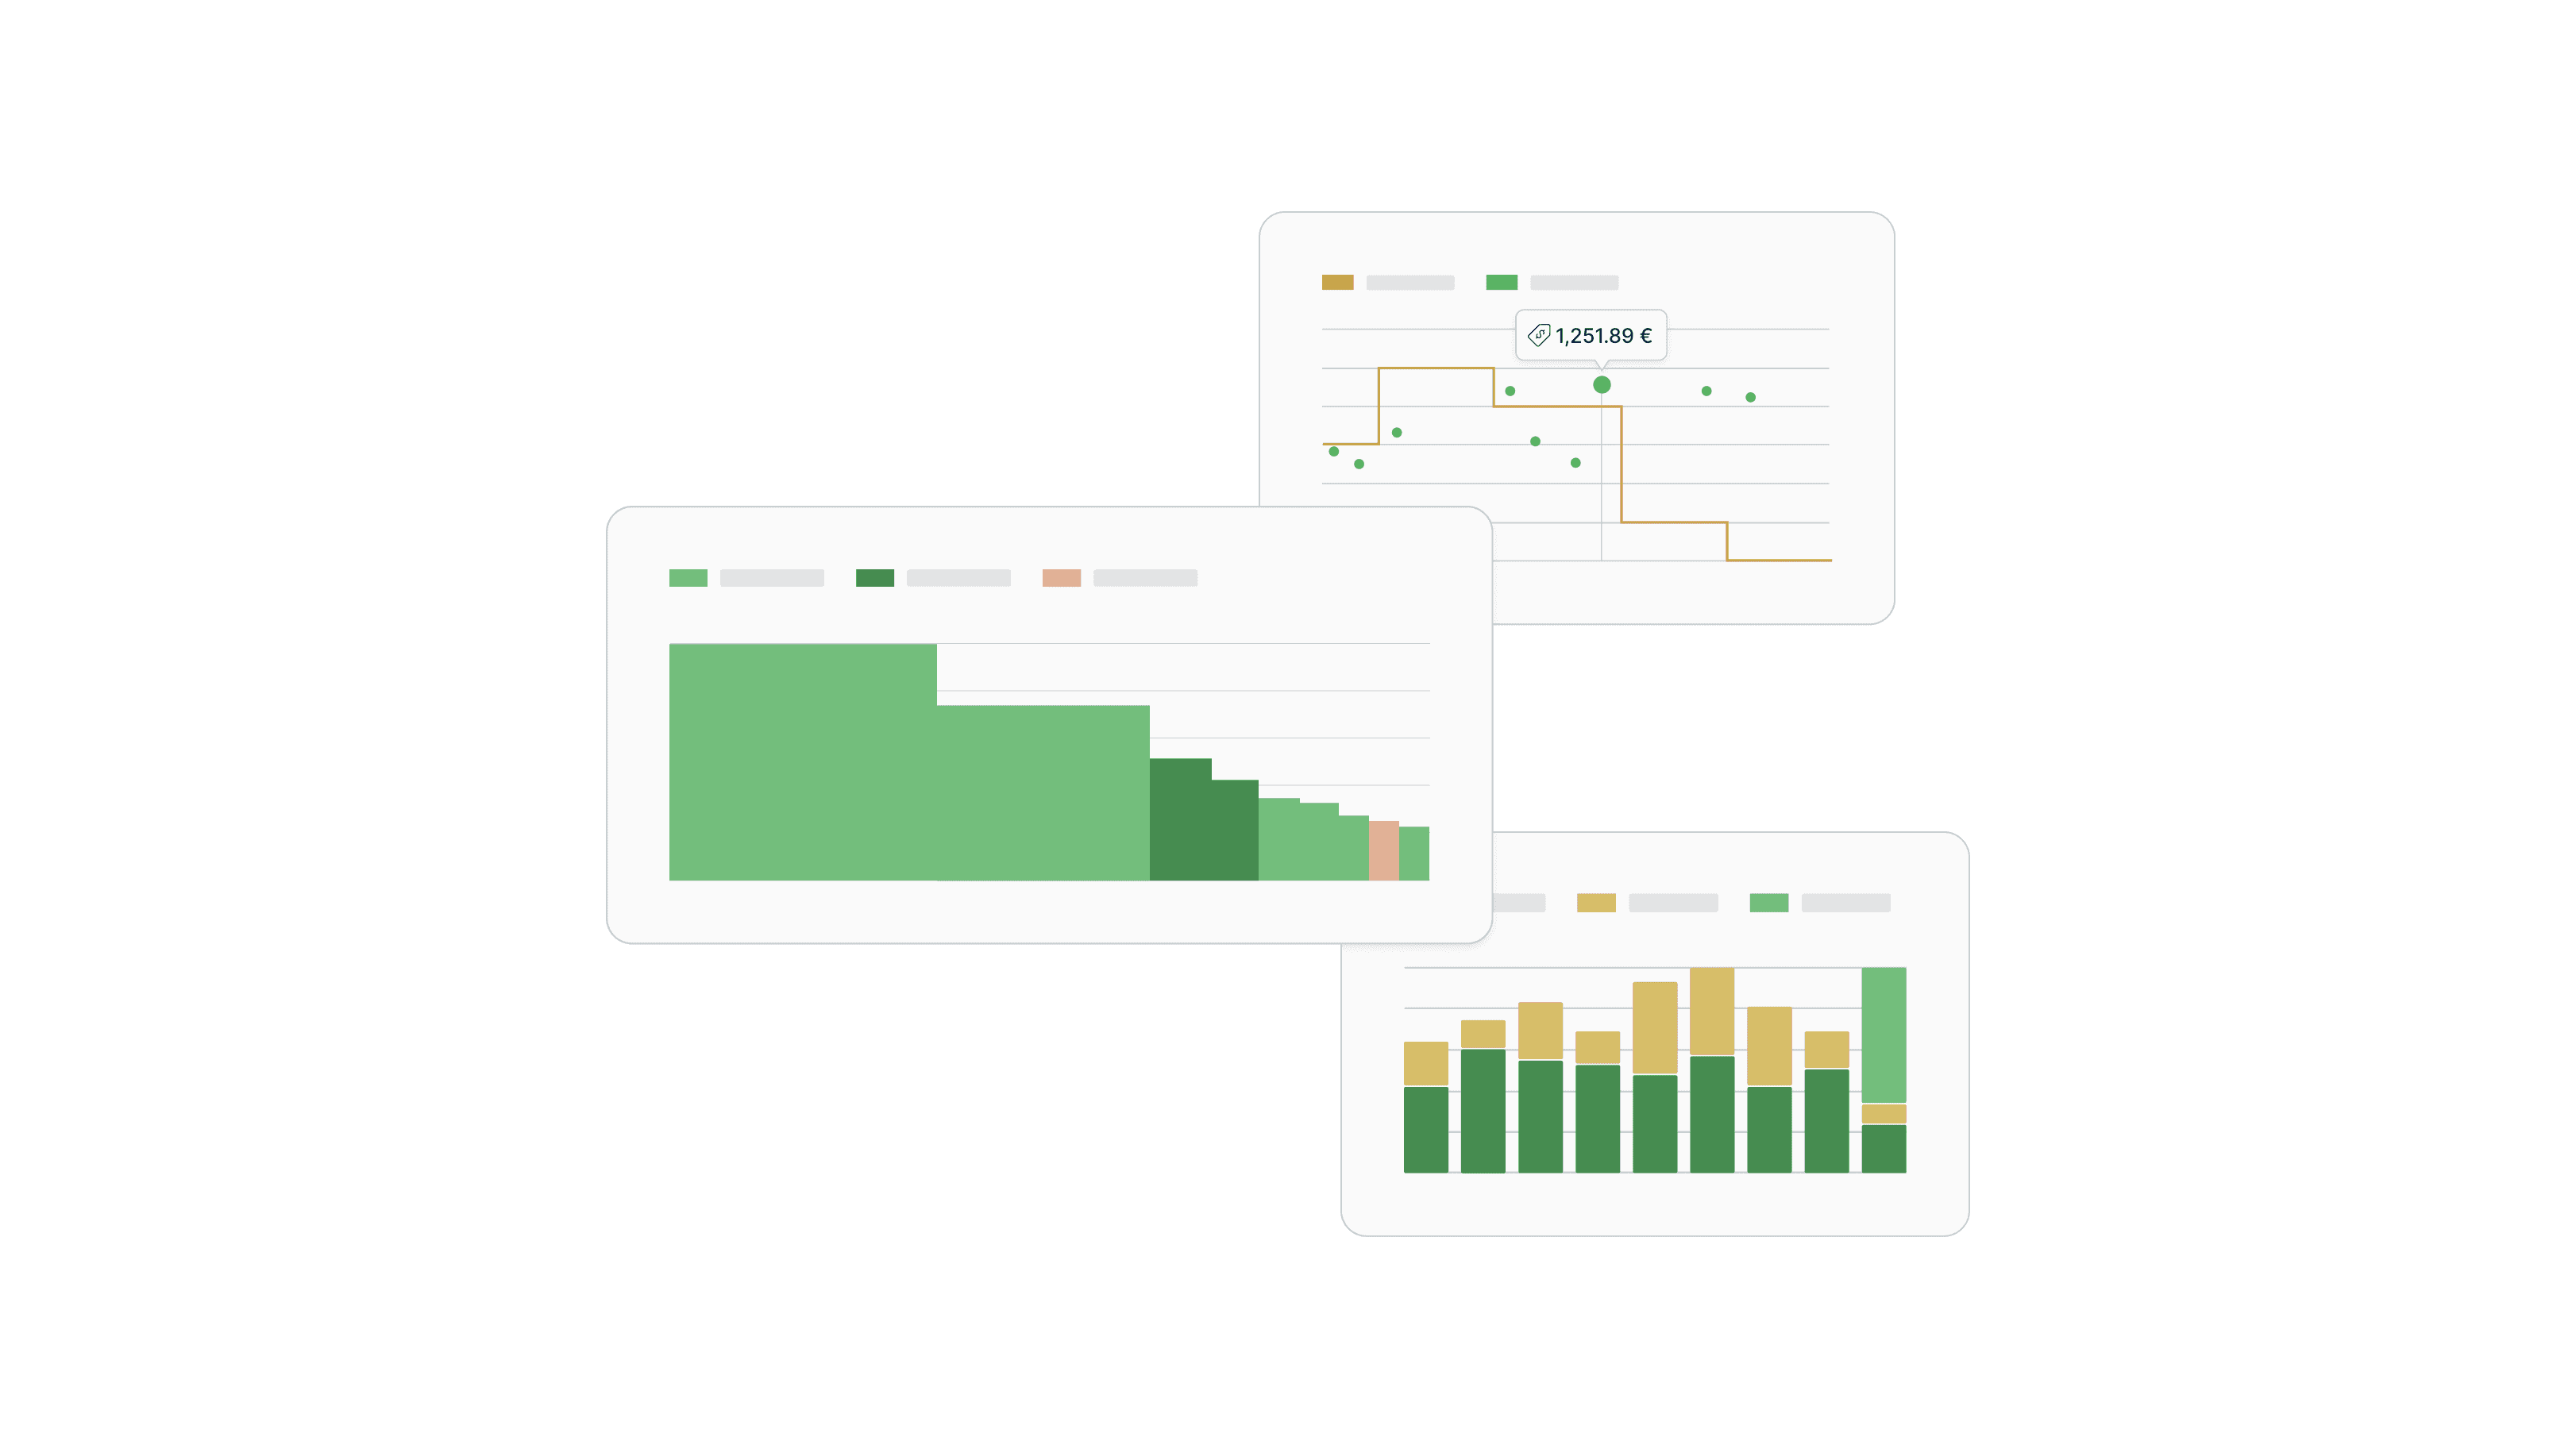
Metalshub Analytics Center
How it Works in PracticeHow it Works in Practice
Capture structured sales data automatically.
Every enquiry, offer, bid, and transaction on Metalshub is captured in a structured, standardised format.
Analyse performance across deals, customers, and prices.
Use purpose-built dashboards to evaluate conversion rates, pricing performance, netback, and customer behaviour.
Optimise margins and execution.
Identify what drives profitable deals, improve offer strategies, and align sales decisions with market conditions. Read more in our sales analytics blog post.
KEY BENEFITS
Clear Margins. Better Execution.Clear Margins. Better Execution.

Full sales performance transparency
Understand how offers convert into deals across products, customers, and channels.

Netback clarity by deal
See true realised margins after costs, not just headline prices.

Improved pricing and payment strategies
Evaluate spot prices, benchmarks, and payment terms to sharpen commercial decisions.

Stronger customer focus
Analyse customer behaviour, concentration, and contribution to revenue.

Sales team accountability
Track activity, responsiveness, and deal outcomes across sales teams.

Market-aligned decision-making
Anchor sales execution in real transaction-based market data.
Key Features
Purpose-Built Analytics Suite for SalesPurpose-Built Analytics Suite for Sales
Basic Analytics
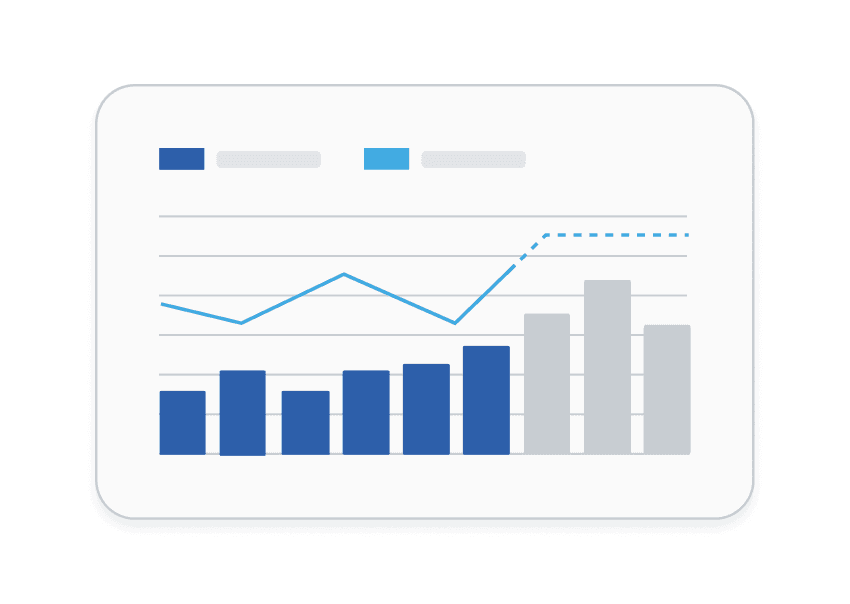
Get an immediate overview of sales activity. Track volumes, transactions, enquiries received, offers sent, deals concluded, and new customers by product, customer, enquiry, timeframe, and entity.
Performance Analytics
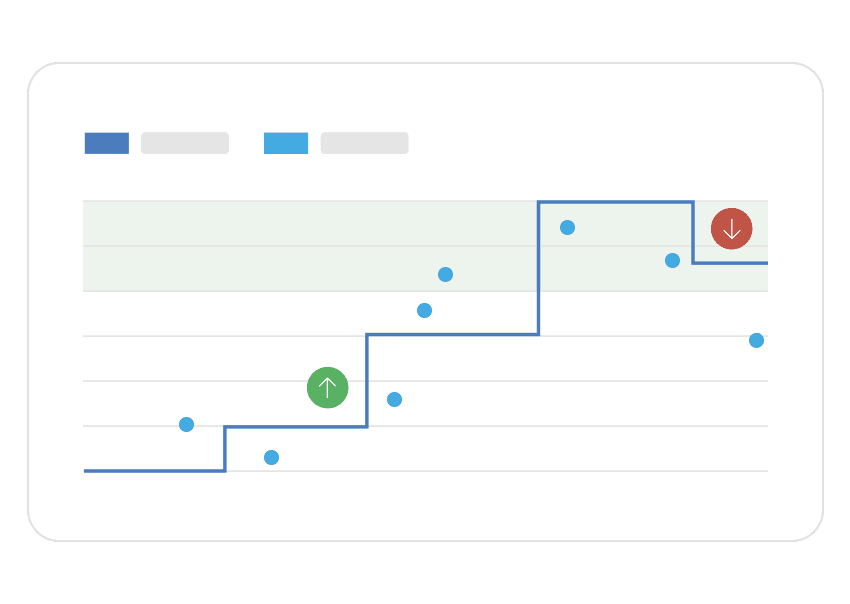
Understand how offers turn into deals. Analyse offer states, spot prices versus benchmarks, and payment terms to identify where deals are won, lost, or delayed.
Netback Dashboard
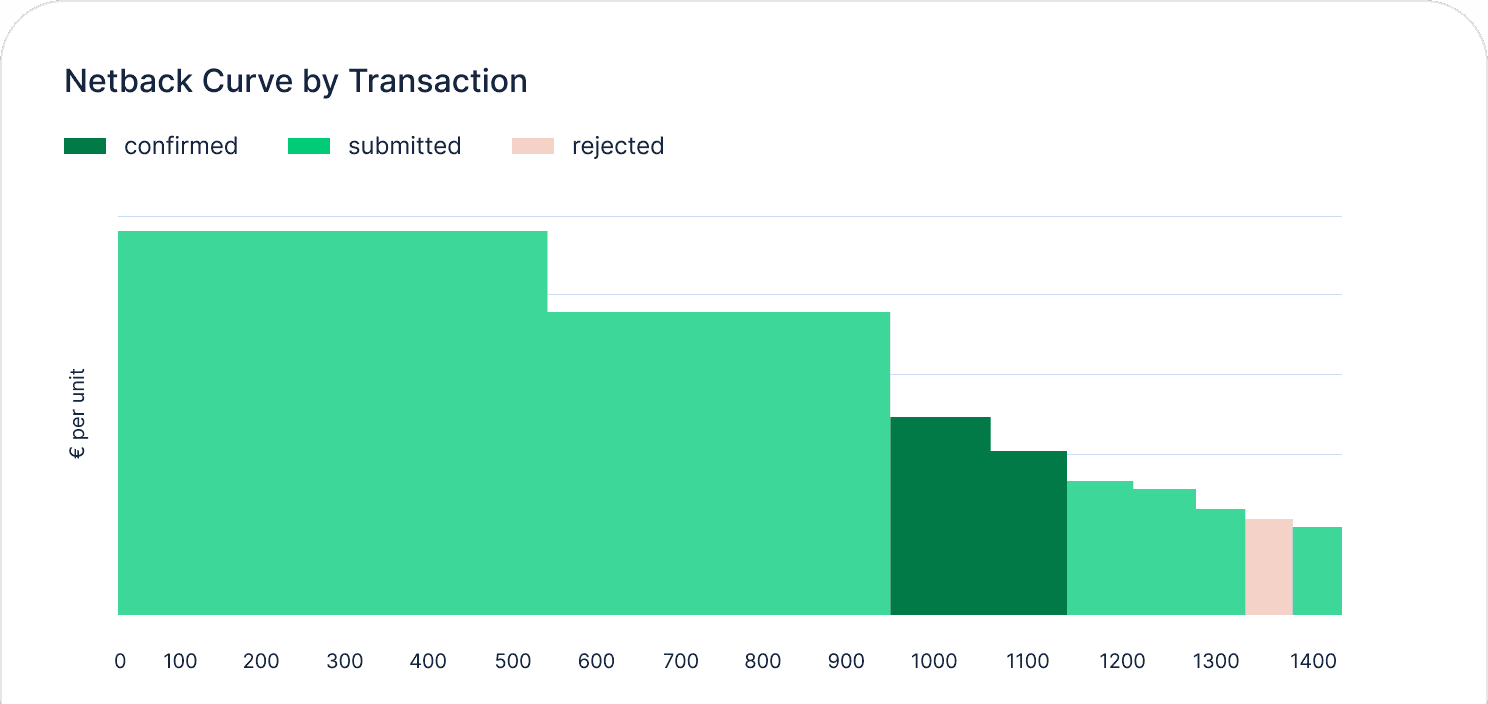
Evaluate real profitability. Define your own netback logic by incorporating costs such as freight, financing, insurance, and treatment charges, then analyse netback curves and deal-level netback performance.
Inventory Analytics
Gain visibility into inventory exposure and sales positioning. Use inventory analytics to better understand stock levels, turnover dynamics, and how inventory availability interacts with sales execution and pricing decisions.
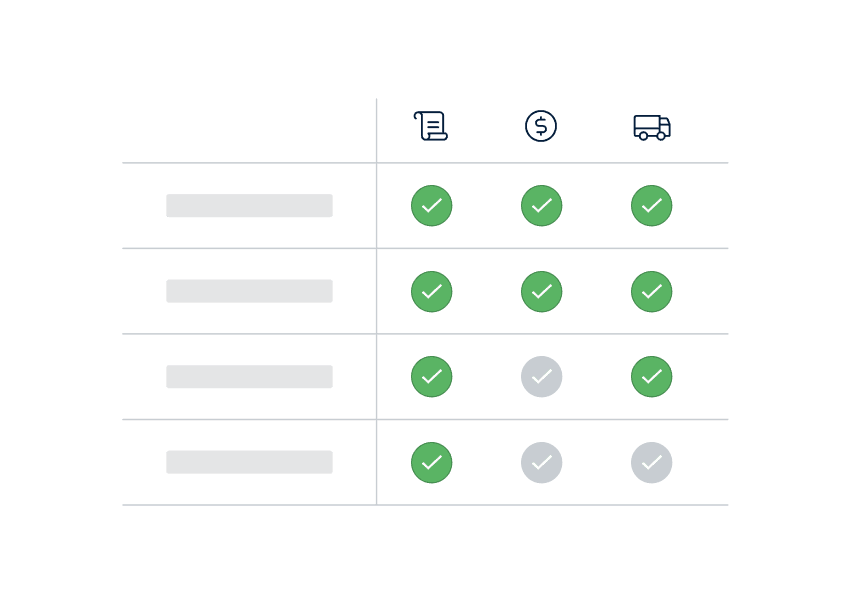
ESG Insights
Monitor customer concentration and exposure. Analyse customer landscapes and revenue distribution to support ESG reporting and responsible sales practices.
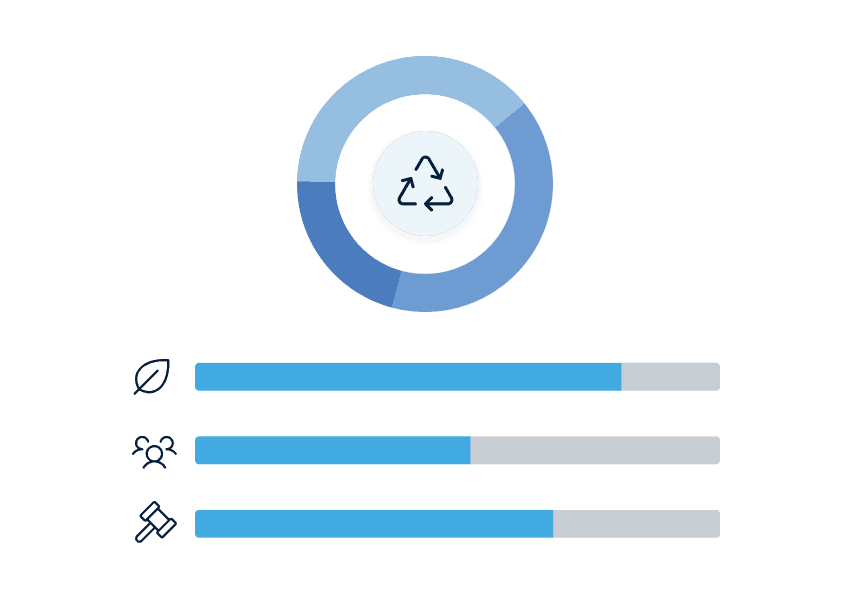
Team Analytics
Understand how your sales organisation performs. Evaluate sales team activity, responsiveness, and deal execution using structured performance data.
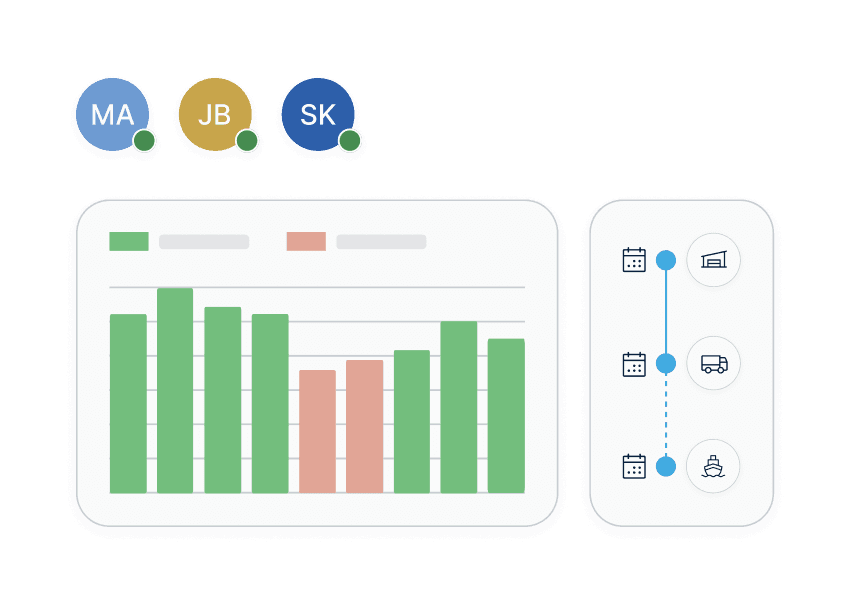
Price Indices
Put sales decisions into market context. Track demand and supply signals, freight rates, and transaction-based price indices derived from real trading activity on Metalshub.
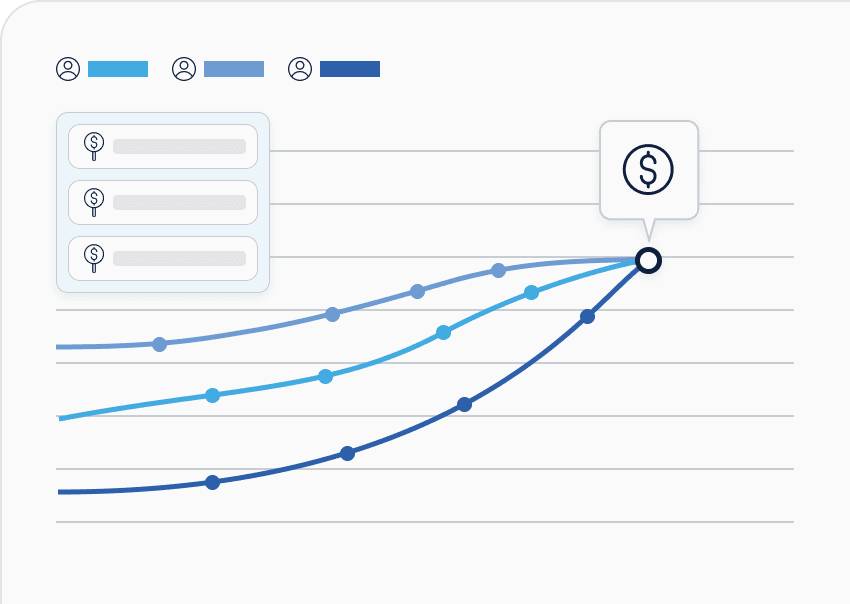
Raw Data Download & Custom Dashboards
Use your data your way. Export structured datasets or build custom dashboards tailored to internal KPIs, margin analysis, and management reporting.
Metalshub Analytics Center
Technical DetailsTechnical Details
Data source: All analytics are based on structured data generated through Metalshub sales workflows.
Data security and confidentiality: All data is handled according to the highest security and confidentiality standards. Transaction data is securely stored, access-controlled, and only visible to authorised users.
Filters: Dashboards can be filtered by product, customer, enquiry, timeframe, and organisational entity.
Netback logic: Netback calculations are configurable and defined by the seller.
Access: Basic Analytics are available for free. Advanced dashboards depend on the subscription level. Book a call with our team for more information.
Reusability: Data can be exported or used in custom dashboards for internal and external reporting.
Ready for More Information?
Discover how Metalshub can streamline your procurement, sales, or tolling processes. Contact us and book your demo now for a firsthand look.